[PDF] When you open AthTek NetWalk, you will see the impressive graphic monitor interface which displays the current network traffic statistics. Some network administrators love AthTek NetWalk because of the graphic monitor interface. Do you know that you can customize the graphic monitor interface as you need? In the following post, you will read how to customize the graphic monitor interface easily.
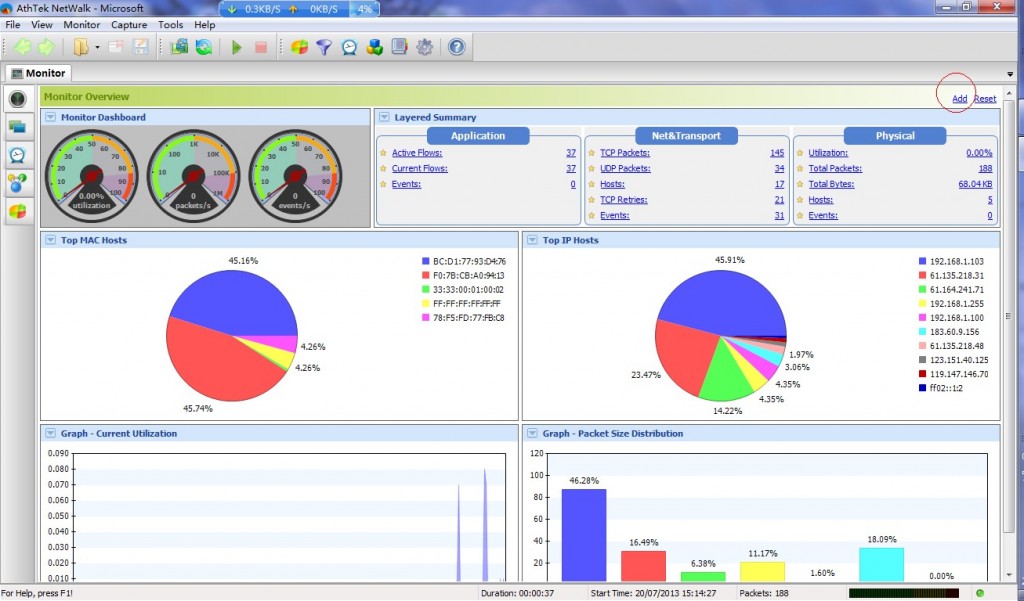
In default monitor interface of AthTek NetWalk, there are 6 components in 3 rows. They are Monitor Dashboard, Layered Summary, Top MAC Hosts, Top IP Hosts, Graph – Current Utilization and Packet Size Distribution. You can find some general options by clicking the drop-down arrow on top left corner of each component. There are many other components you can add to the monitor interface. You can also choose the place where you want to display the component. Now let’s getting started to customize the monitor interface of AthTek NetWalk!

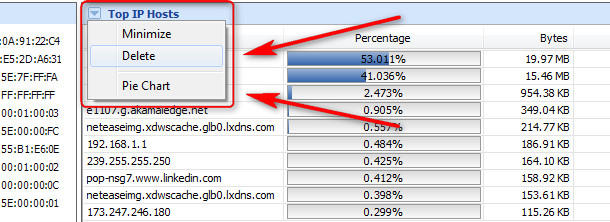
1. How to delete the component?
Click the drop-down arrow and you will see the delete option. For example, you want to delete the option of Top IP Hosts. You can click the drop-down arrow of Top IP Hosts component and choose Delete option, and then the component will be deleted from monitor interface. Particularly, you can also switch the graph from pie chart to host list.
2. How to add a new component to monitor interface?
Click “Add” on top right of monitor interface and then you will see the “Add Component” window. There are 8 types of components which you can add to the monitor interface. If you choose to add a graph, you will be asked to choose a graph type from 9 graph types. For example, you want to add a Monitor Packet Trend to 2nd row and 2nd column. Click “Add” on top right corner and choose Monitor Packet Trend in type, choose 2 in row and column. Press OK to add.

3. What components can you add to the monitor interface?
| Component Type | Introduction |
| Monitor Dashboard | The dashboard of real-time utilization, packet and event. |
| Monitor Packet Trend | The packet trend every 20 seconds in monitoring. |
| Monitor Utilization Trend | The utilization trend every 20 seconds in monitoring. |
| Monitor Event Trend | The event trend every 20 seconds in monitoring. |
| Top MAC Hosts | Top 10 active MAC addresses. |
| Top IP Hosts | Top 10 active IP addresses. |
| Layered Summary | The traffic summary of application, network and physical layers. |
| Graph | Including current utilization, application layer protocols packets, ping requests and replies, TCP SYNs/FINs/RSTs, TCP vs UDP, ARP requests and replies, broadcasts multicasts vs total, DNS successful queries vs failed queries, packet size distribution. |