[PDF] Real-time network traffic monitoring and analysis are two core works to most enterprise network administrators. However, most administrators soon give up on network monitoring. This is because they find collecting network traffic complicated. Even if they manage to capture network conversations they find it challenging to analyze the raw data in a meaningful way. In this article, you will read how to monitor and analyze real-time network traffic by the great network monitoring software– AthTek NetWalk. If you have no idea about this software, please download and install the free personal edition for a quick view.
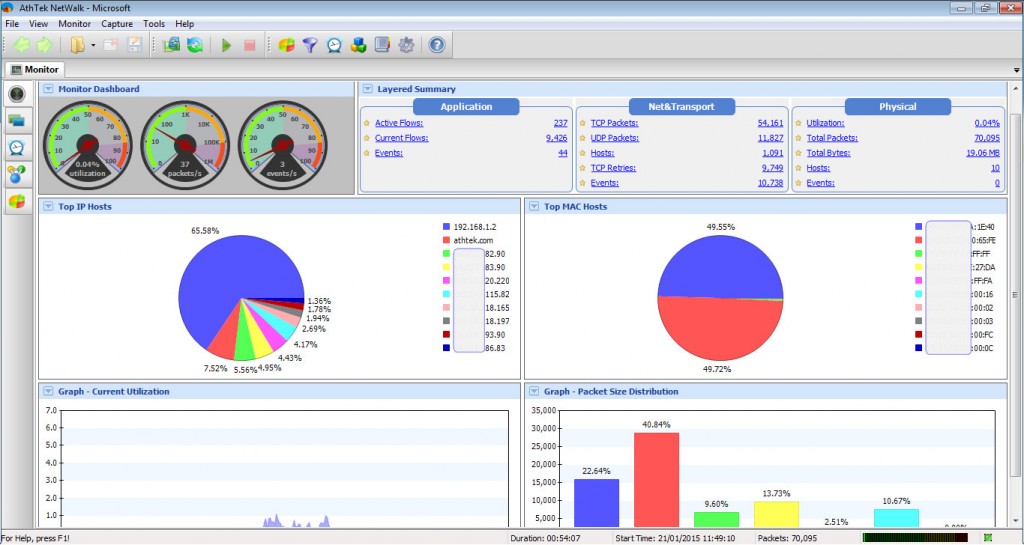
When you open AthTek NetWalk for the first time, you will be asked to choose an internet adapter of your network. You can also switch to another one in program’s toolbar. After then the real-time network traffic will be displayed in some dynamic diagrams in AthTek NetWalk. Acquiescently you will see some raw data in real-time such as top hosts and bandwidth utilization. You can customize these real-time dynamic diagrams as you need. If you don’t need to do further troubleshooting, these dynamic diagrams could be a network analytic report for real-time network monitoring, and if you want to monitor real time computer activity, did you know that you can also monitor PC activity where staff are working remotely? It’s a great tool so very much worth looking into if you have remote workers and need to monitor more than just the network activity.
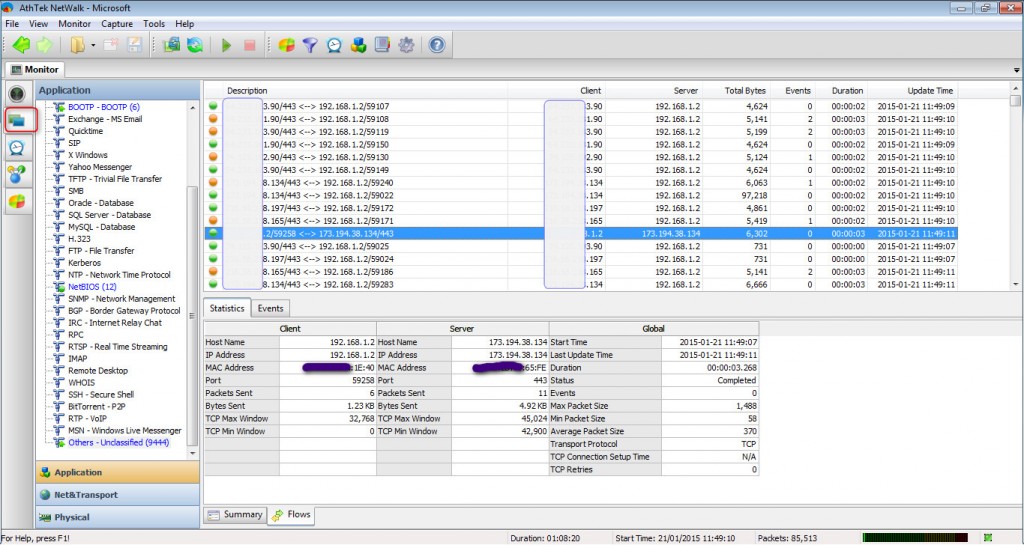
For more network analysis details, please click to access the second tab– Layered View. In this tab you can see the detailed network monitoring data in Application, Net&Transport and Physical layers. All the internet requests will be disclosed completely and displayed in groups.
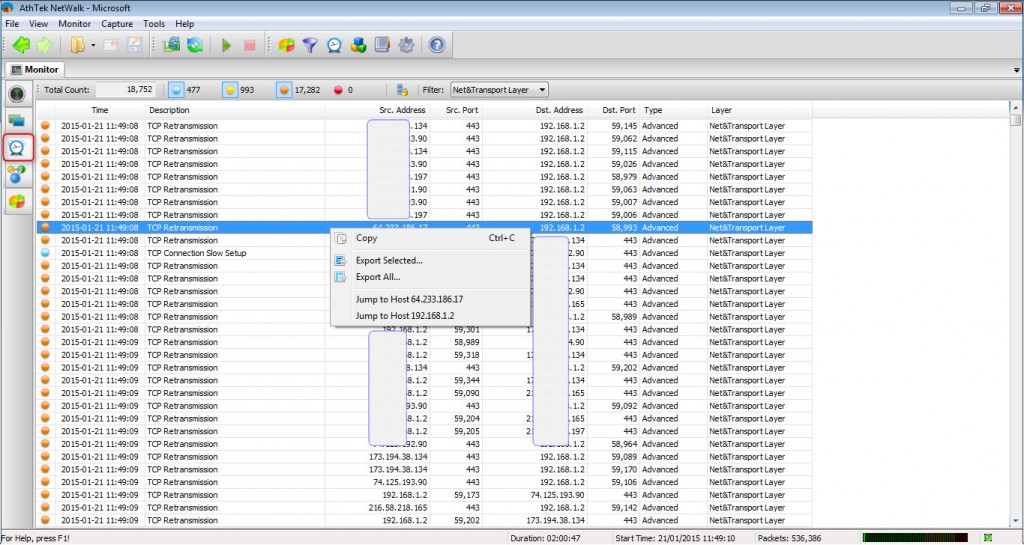
Click to access the third tab and you will see all the events happened during network monitoring. Blue ball stands for TCP Connection Slow Setup. Yellow ball stands for TCP Out of Order. Orange ball stands for TCP Retransmission. Red ball stands for TCP Important Errors. Right click on any of the records, and then network administrator can jump to the Net&Transport layer for troubleshooting.
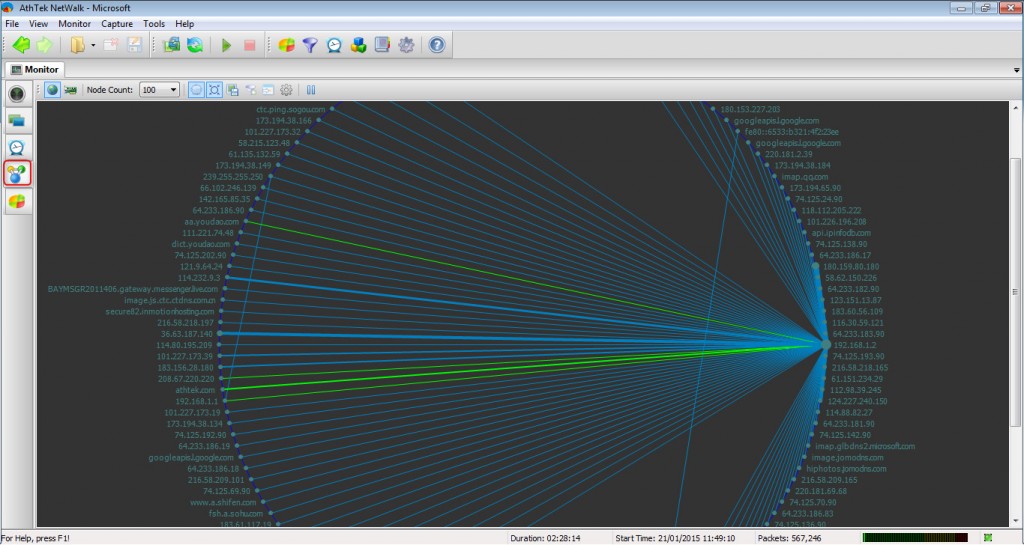
Click on the fourth tab and you can see the real-time matrix map of your network. You can choose to display the Matrix Map on IP/Domain or MAC address basis. Green line stands for real-time activate connection and blue line stands for historical connection. Like in Events tab, double click on any of the addresses network administrator can jump to the Net&Transport layer for troubleshooting.
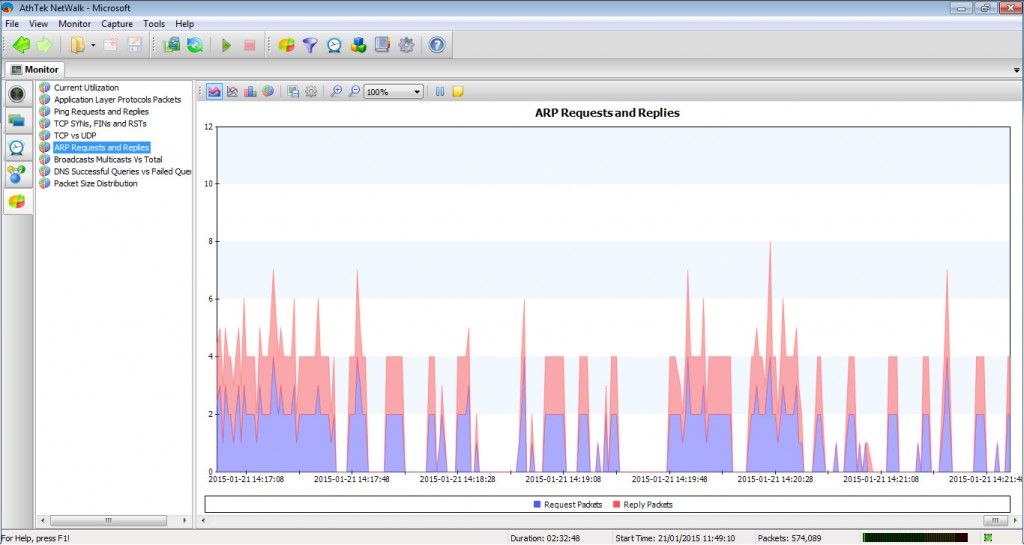
Click on the last tab, you will see the real-time traffic in dynamic area chart, curve chart, bar chart or pie chart.