[PDF] Bandwidth utilization is a well-known, but not a well-understood network statistic. Bandwidth utilization is one of the most basic and one of the most critical statistics available in a network analyzer. It shows the current traffic levels on the segment or link, compared to the theoretical maximum. Network administrators often want to know bandwidth utilization either as a percentage of available or a bitrate. Bandwidth has more chaotic transitions than CPU. It isn’t an simple work to know the traffic on specific host. But if you have AthTek NetWalk installed on your enterprise network, you will be able to generate a bandwidth utilization graph for specific host effortlessly.
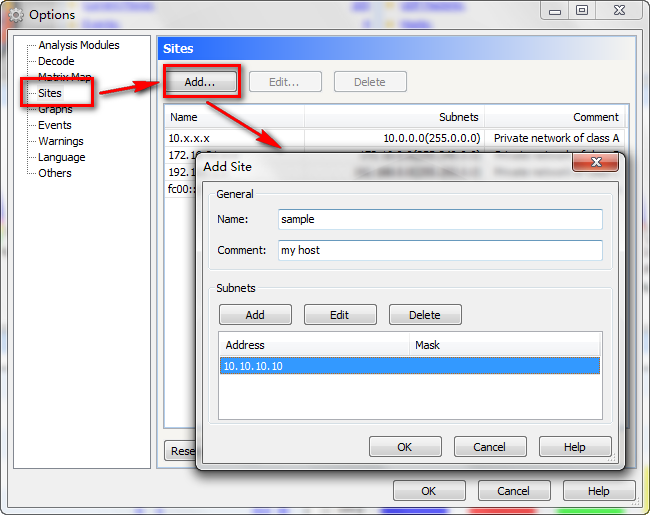
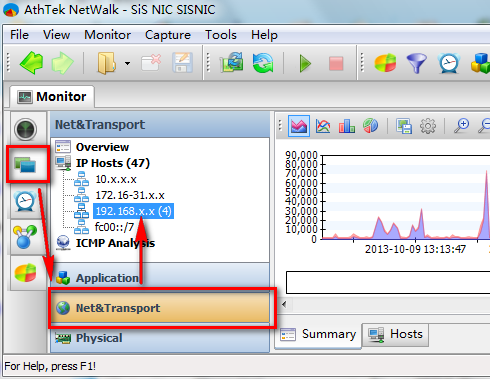
 First of all, you need to add the host to AthTek NetWalk. Open AthTek NetWalk and go to Tools – > Options… -> Sites, you will see a list of hosts under monitoring. Simply click Add to add new host to the list, and you would be able to view the bandwidth utilization graph for this host in [Layered View] -> [Net&Transport].


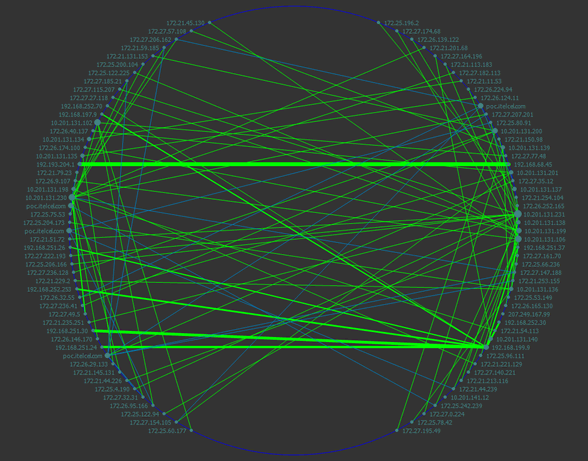
You can add multiple hosts to AthTek NetWalk and generate the bandwidth utilization graph in different kinds of charts. If it was a postmortem analysis of captured packets, you can even view the conversation contents in traffic flows and active hosts in matrix map.

Matrix Map